

This topic is as complex as it is opaque, sitting at the nexus of technology, economics, politics, the environment, and quality of life. We sought to demystify each strand and show readers — through original data reporting, interactive design, and illustrative interviews — the true scope of an industry central to America’s AI ambitions. By revealing who shoulders the costs of this boom, we provided readers with the information necessary to make informed decisions about infrastructure that is rapidly redrawing the American landscape. We did it with rigor, nuance, and a level of explanatory depth that has rarely existed in previous coverage of the data center industry.
At the center of the project was an original database and interactive map of 1,240 data center sites across the United States. Because no comprehensive public database exists, assembling this information required extensive reporting and verification across corporate disclosures, property records, utility filings, tax agreements, development documents, satellite imagery, and local reporting. We published our methodology so readers could understand how we arrived at our findings, and so researchers, policymakers, and journalists could replicate or build upon the work.
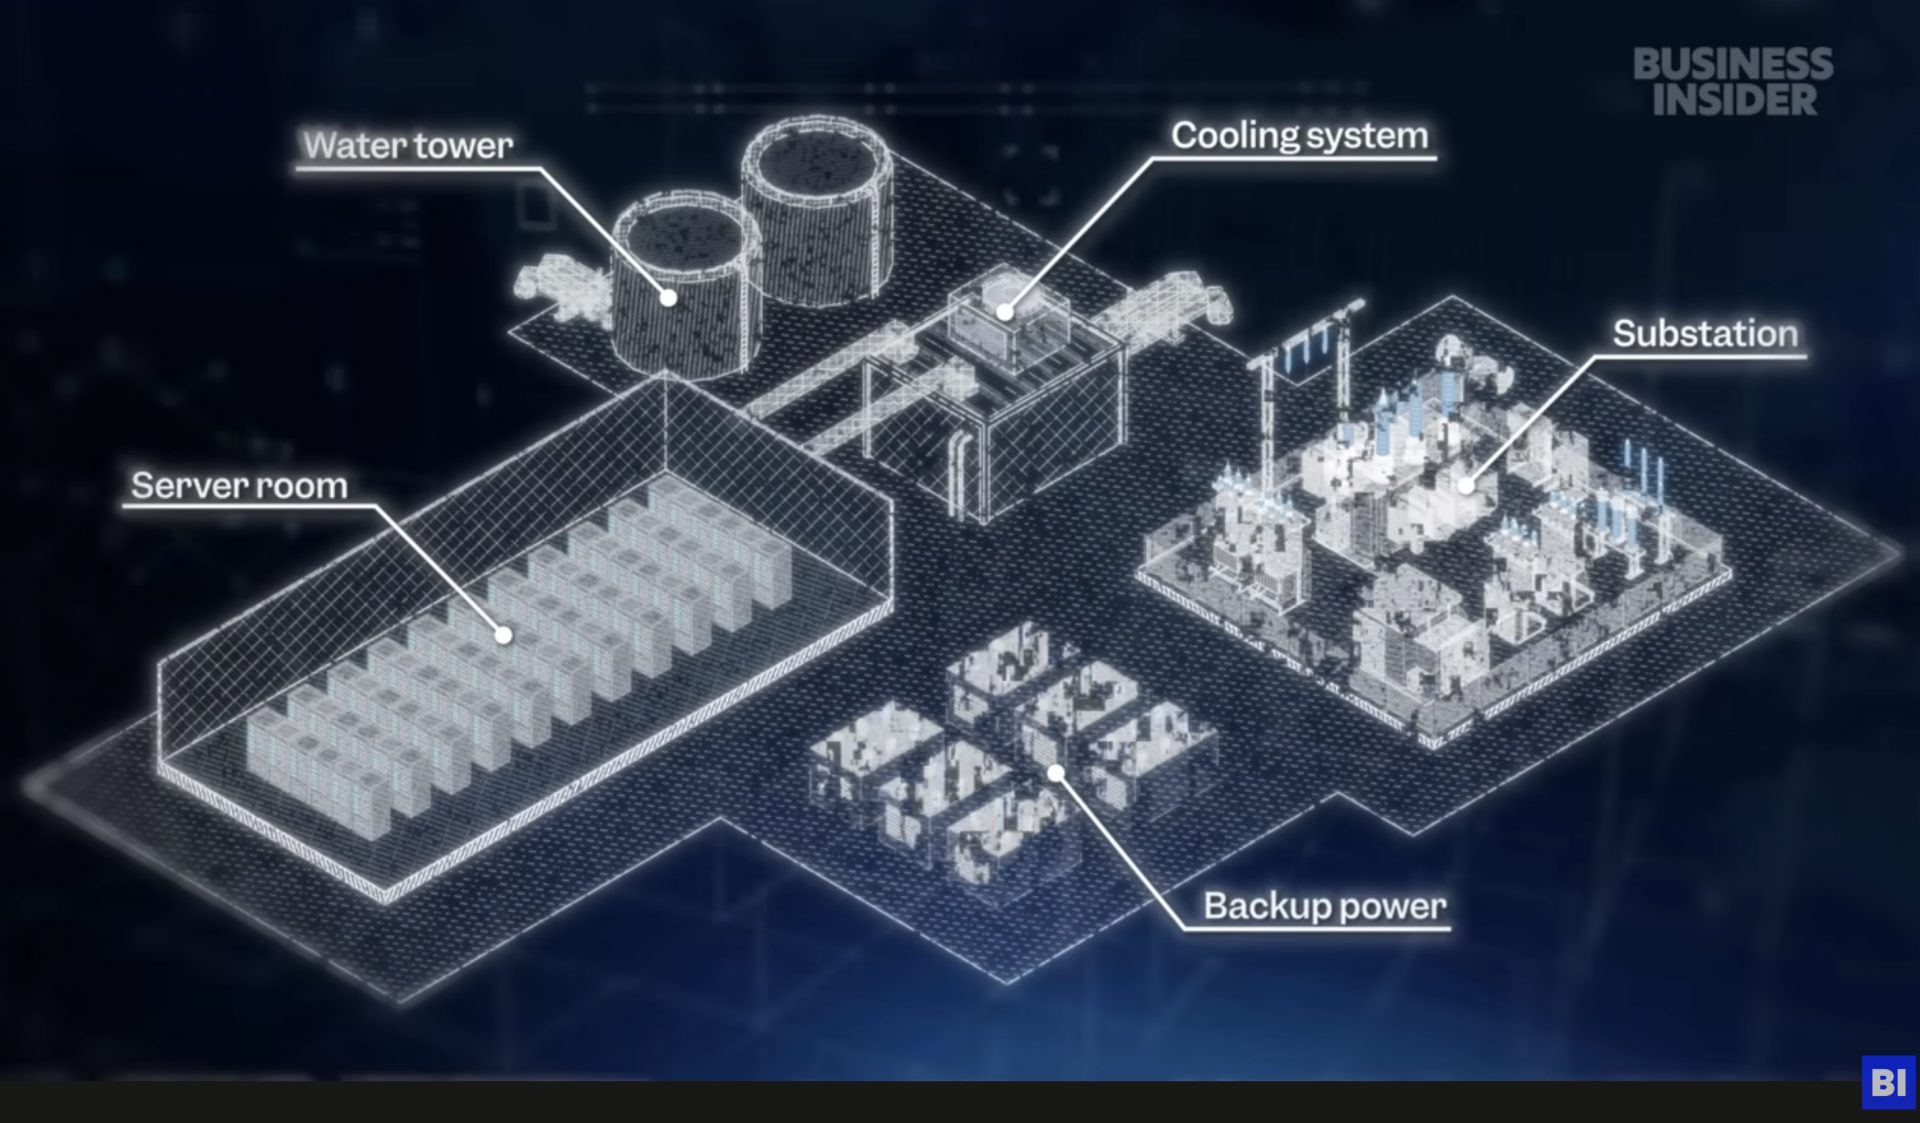
We prioritized reader understanding at every stage of the presentation, using real-world examples alongside accessible charts, maps, and multimedia elements designed specifically for digital and mobile platforms. The interactive experience allowed readers to explore all 1,240 sites themselves, while embedded visuals translated technical infrastructure and environmental impacts into clear, intuitive storytelling.
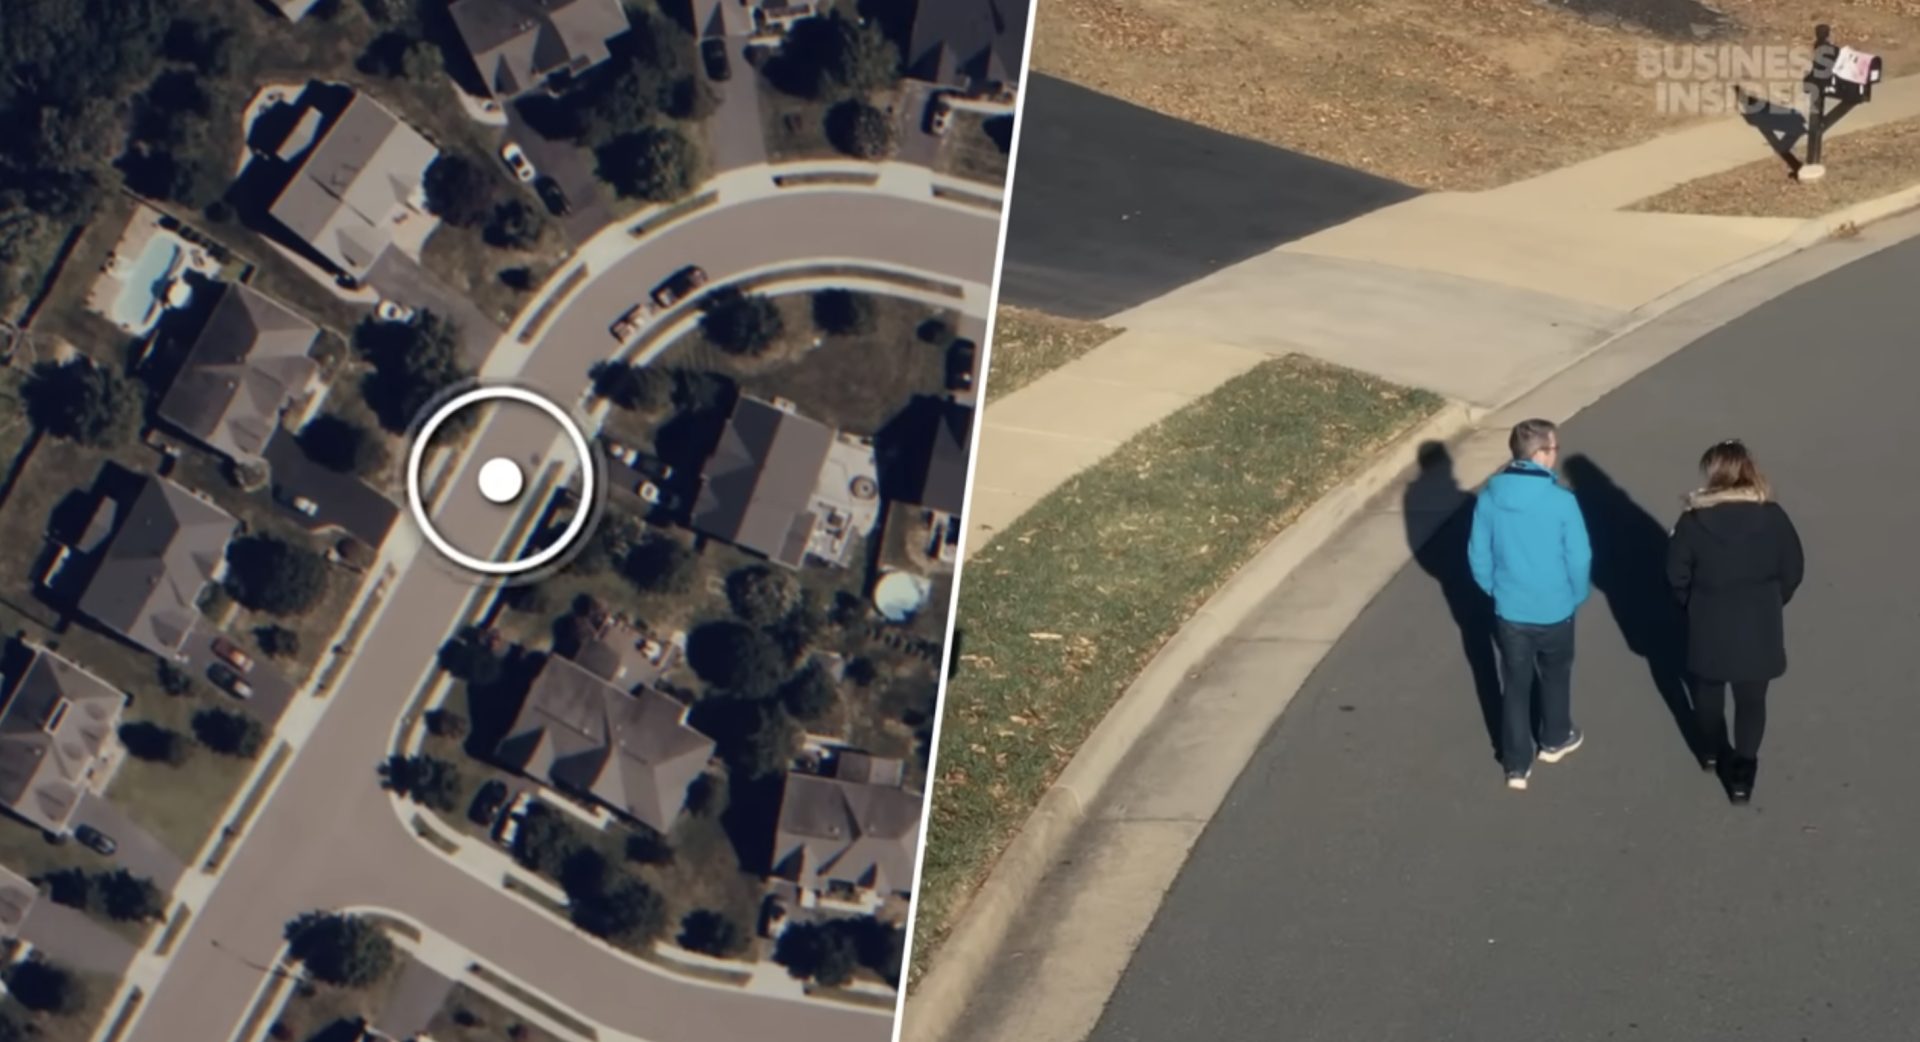
Explaining the consequences of the AI infrastructure boom took many forms. One story embedded sound so readers could hear the difference between a Virginia suburb with and without a nearby data center. Another paired mapping and climate data to show the rapid growth of data centers in some of the driest parts of the United States. Throughout the project, we used data visualization not simply to illustrate findings, but to help readers experience and understand the scale of the transformation underway.
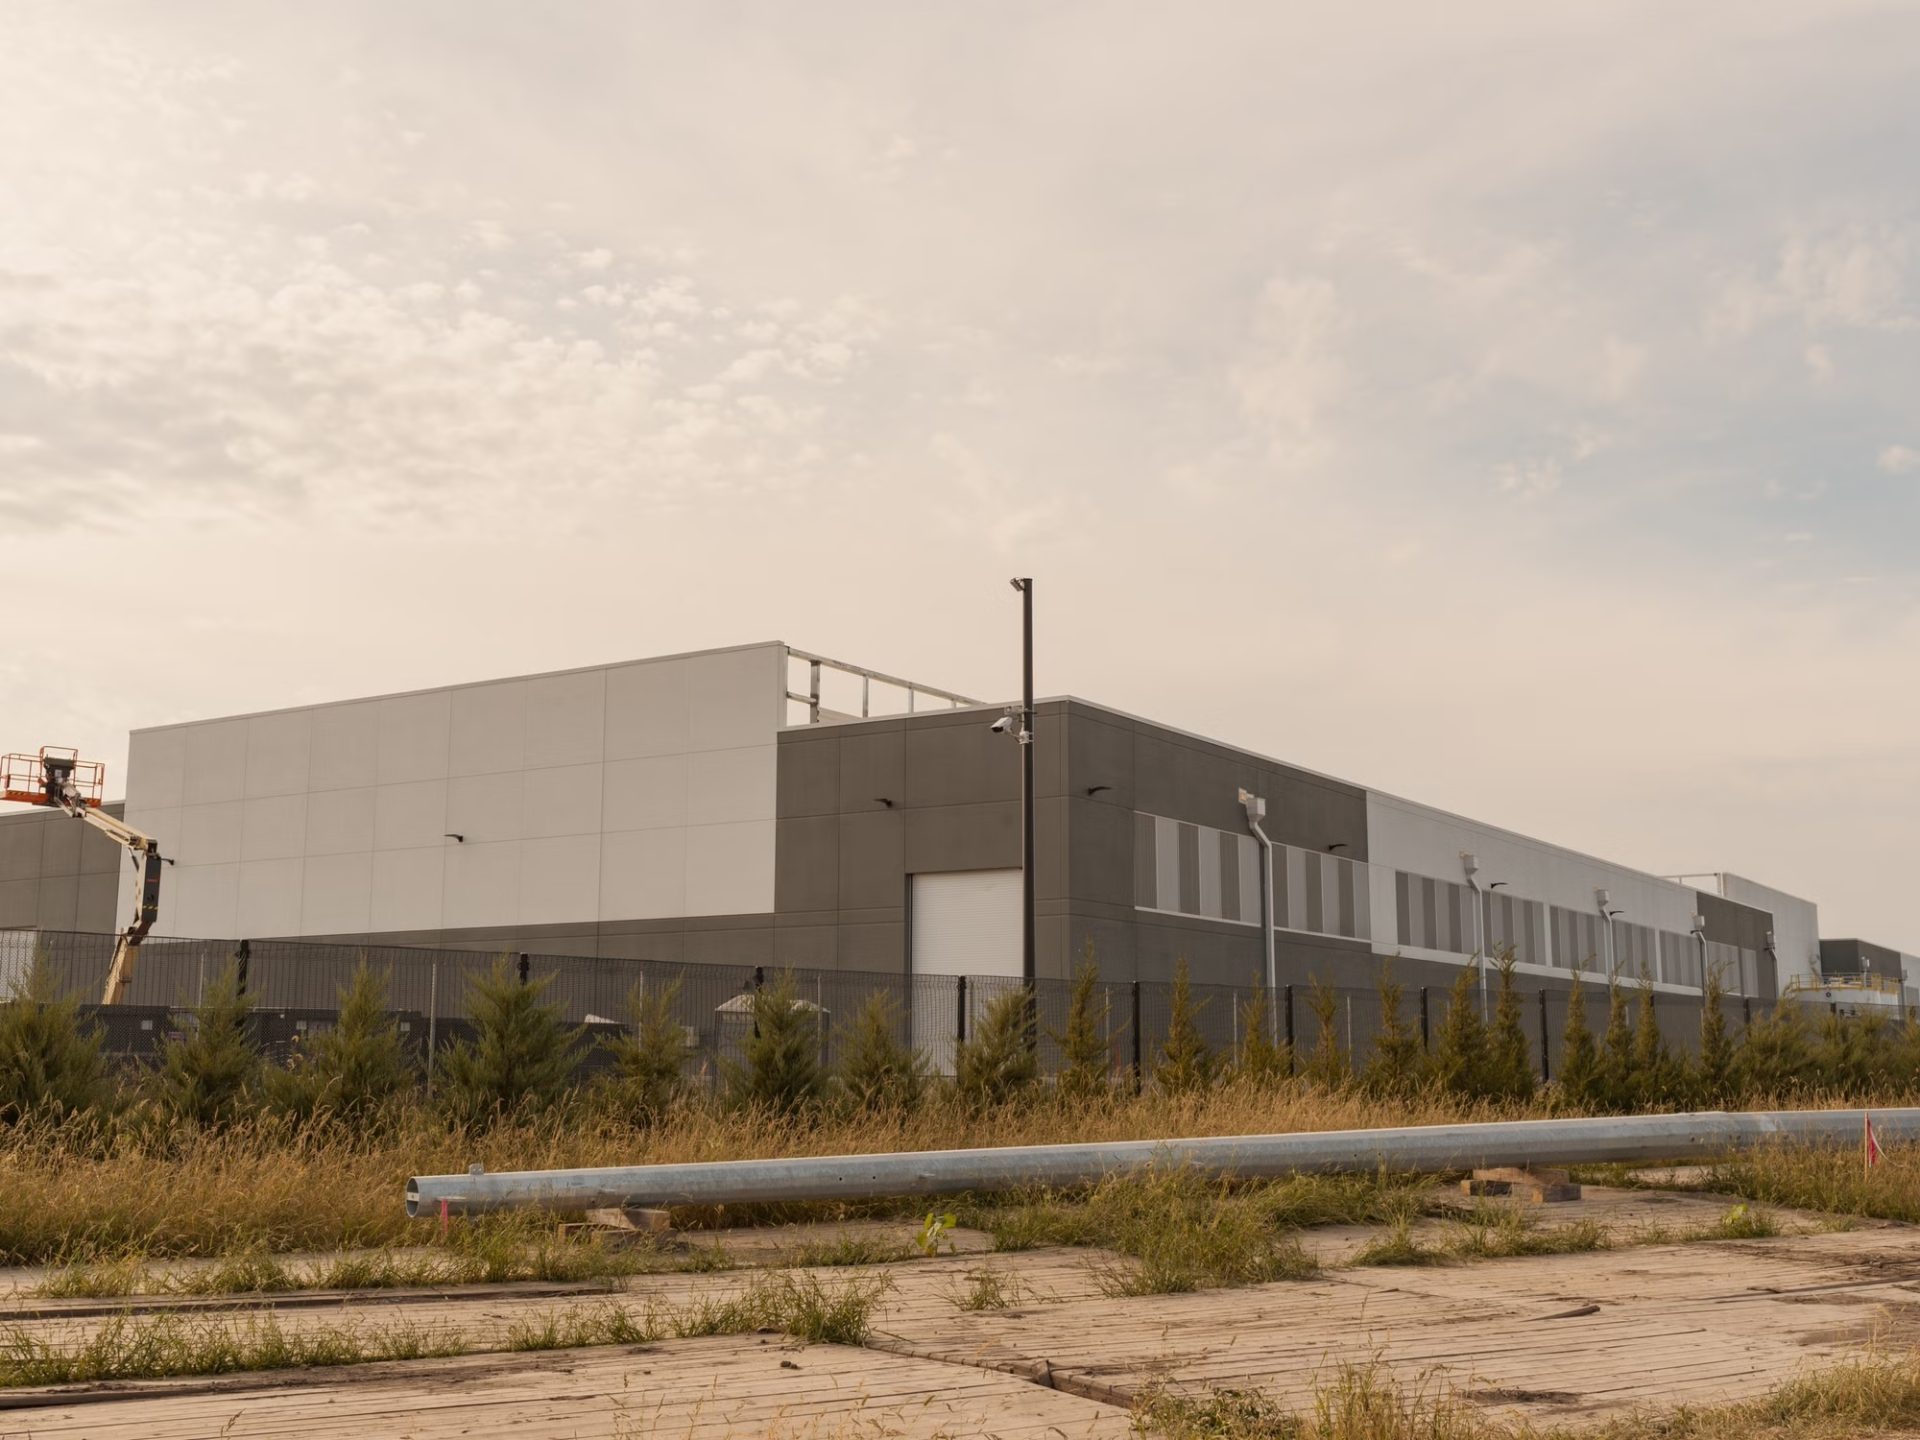
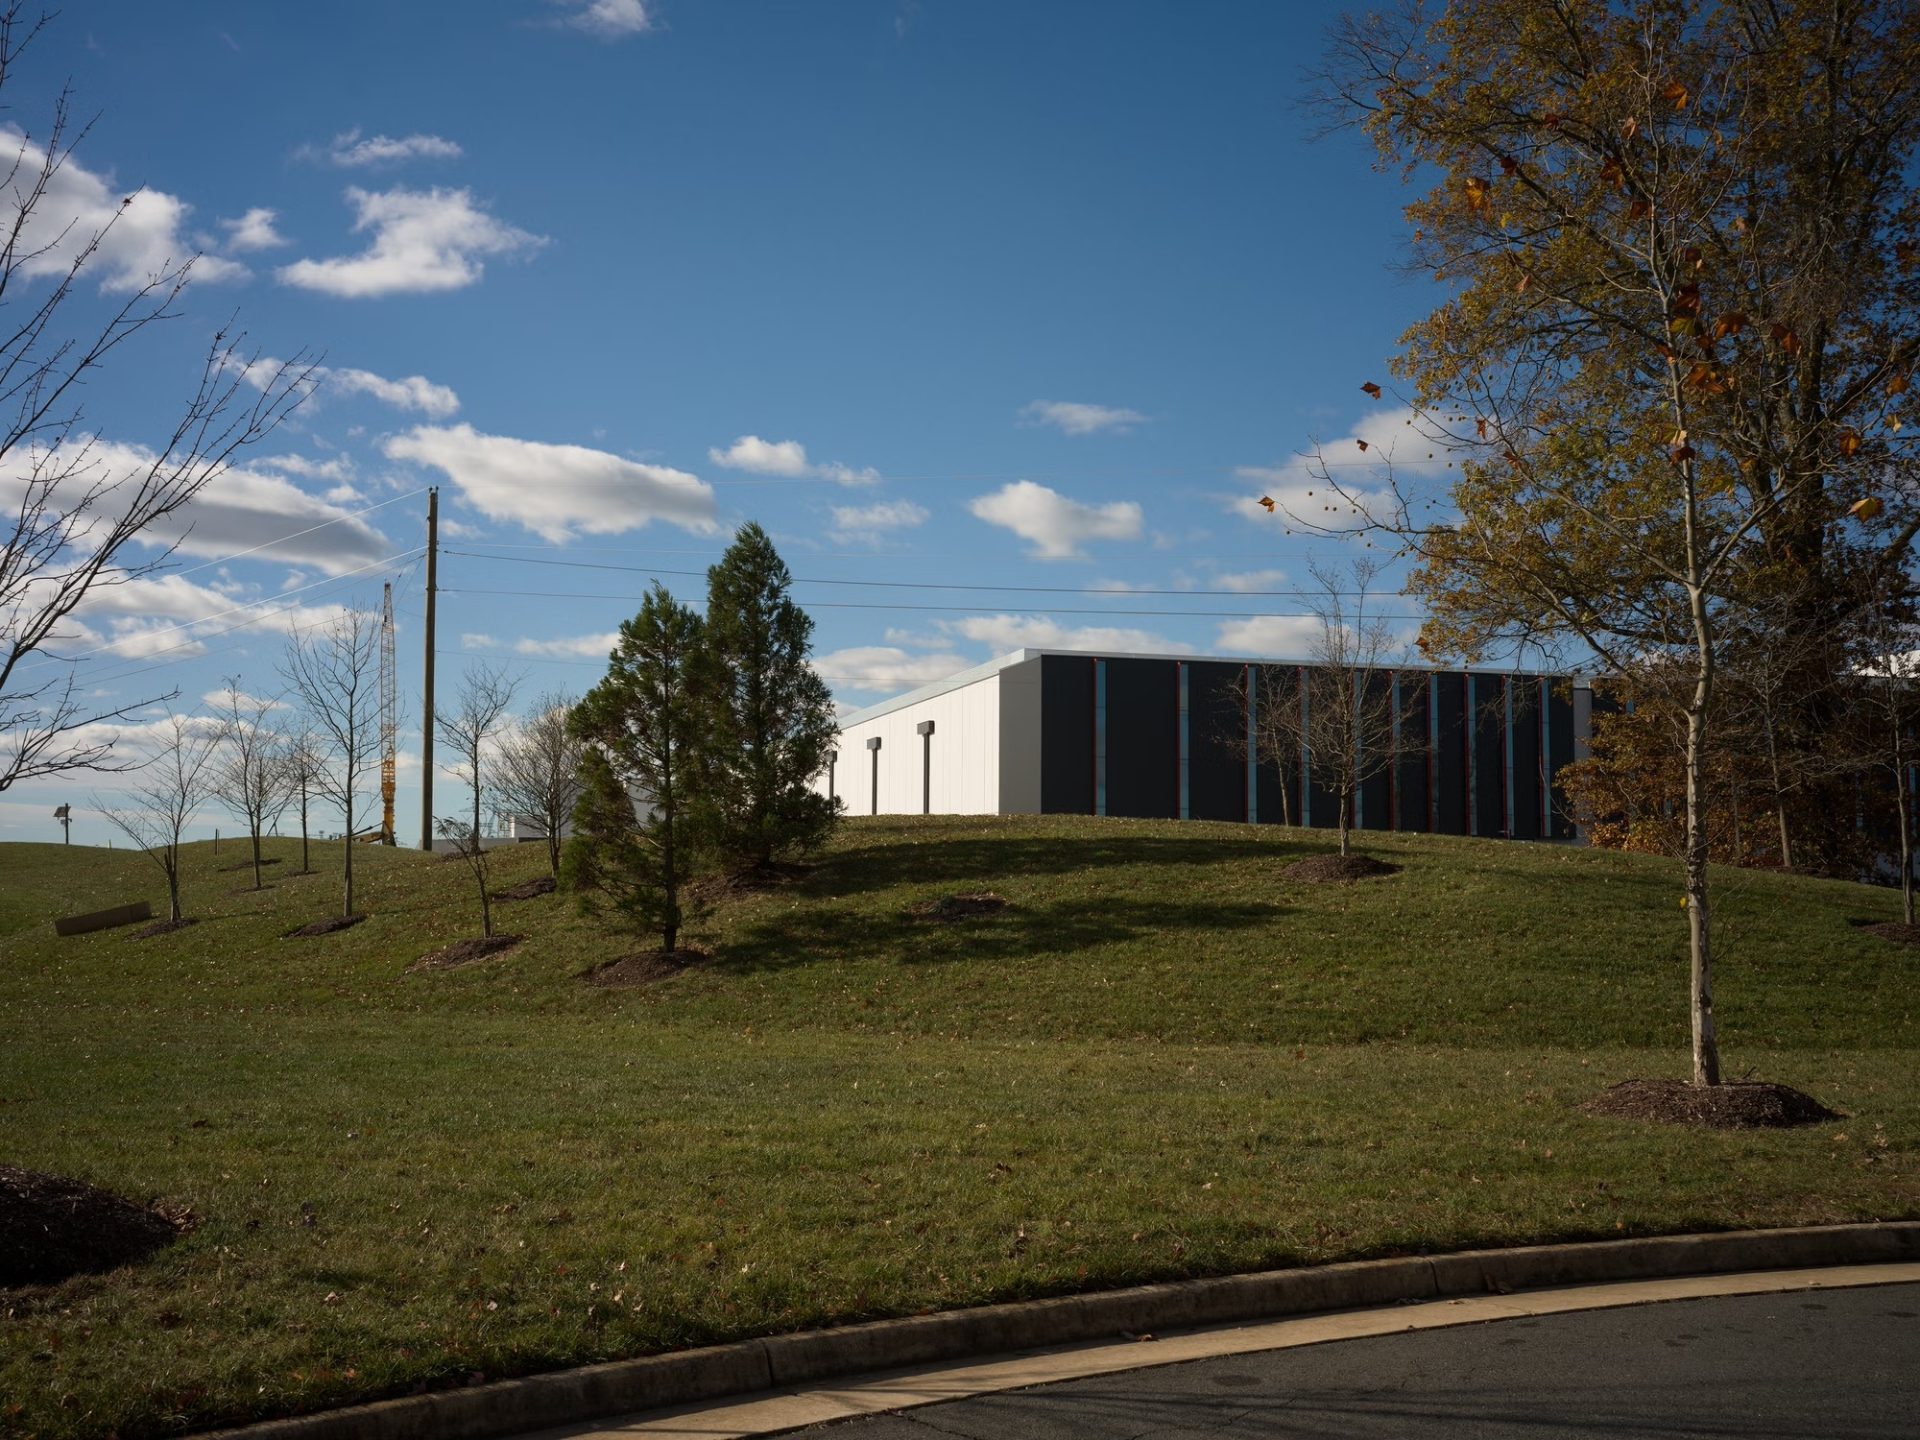
We also traveled to Virginia, Arizona, Colorado, Wyoming, Georgia, and Ohio to document the lived experiences behind the data. “The AI boom pits neighbor against neighbor” brought readers into communities where some residents welcomed rising property values and economic growth, while others struggled with construction disruption, strained resources, noise, and environmental degradation. The reporting connected abstract infrastructure expansion to the people living alongside it every day.
Tech companies are projected to spend at least $320 billion this year on AI infrastructure. The benefits of AI remain speculative; the costs are already here. Through original data collection, transparent methodology, interactive storytelling, and on-the-ground reporting, this investigation made visible what communities across America are being asked to bear: drained water supplies, degraded air quality, massive energy demand, forgone tax revenue, and broken promises on jobs — all explained with unprecedented specificity.